

A Tale of Two Multiples
What metrics from CashApp (consumer) and Ramp (SMB) could mean for Chime's valuation

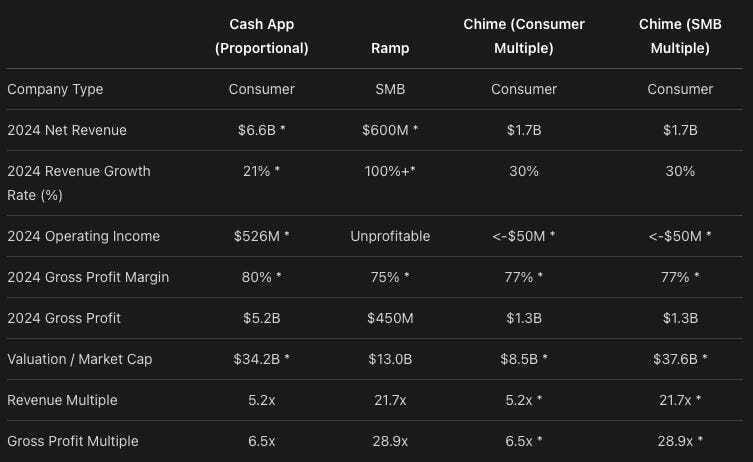
Ramp just completed a mega-secondary round valuing the company at $13B and it made me think that it's time to run some math on multiples for banking fintechs (especially now Ramp has Treasury) to see what that means for Chime.In comparing Cash App (a part of Block) to Ramp to Chime the results couldn't be more stark and it tells us more about the IPO story Chime and Ramp will have to tell as they prepare for their next chapter.You'll see the full story in the table but a couple key takeaways:
Despite Ramp, CashApp and Chime monetizing in exactly the same way, primarily off of interchange on spend volume, there's a stark difference in valuations
Ramp's growth rate is eye-popping and certainly a driver behind a massive uptick in valuation (ARR adjusted down to fiscal year revenue to match comps)
But CashApp's profitability should be attractive to investors in this new environment (and could be a focus point for the future public Chime)
Ultimately, Chime's ability to bridge between pure play consumer and pure play SMB fintech will drive its valuation perception which could range from $8.7B - $38B. Because it caters more to direct deposit consumers vs general consumers, this may help differentiate it from CashApp and justify a higher multiple (alongside likely path to profitability) but it’s unlikely to get fully to SMB multiples, especially without the growth rate. Note - I call Ramp an SMB fintech vs. a B2B fintech because as far as I know, revenue isn't contractual for vast majority of clients but given spend is SMB-related, it's likely more predictable than consumers.Disclaimer: I worked for Chime and loved my time there and continue to be an equity holder and now work for CashApp and love my experience so far. Personally, I'm also a big fan of Ramp. So I don't know where that puts my loyalties but I felt like I should disclaim it.
Where did this data come from?
All data in the table has been surfaced entirely from public press releases and articles that AI can access. Where data is missing, it has been implied from generally accessible industry benchmarks and asterisked. Since CashApp is not a standalone business, relevant metrics have been proportioned from Block. But how did I actually get this data?
CashApp
CashApps’s data can be easily found in Jack’s exemplary shareholder letters and presentations with detailed metrics by business unit. From those metrics, you can get Gross Profit, Revenue, Revenue growth on a Cash App specific basis (normalizing for Bitcoin revenue accounting). For metrics like Market Cap and Operating Income, where business unit specific distributions aren’t available, I take the proportional share of Gross Profit that Cash App has (~59%) and apply that proportionally to each of these metrics.
Chime
For Chime, I’m relying primarily on the great reporting from Forbes columnist, Jeff Kauflin, especially with his work on two recent articles. The first came out in May 2024 and covers Chime’s rise to multi-billion dollar company. The article details that Chime had $1.5B in annualized revenue, $1.3B in revenue and $1B in gross profit in 2023. From there we can further derive a 77% gross margin. More recently, Kauflin reported in February 2025 that Chime had grown its revenue to $1.7B, growing by 30% from 2023 and that it lost less than $50M that year, down from $200M the prior year (so path to profitability is going well).
Ramp
To get Ramp’s data, I had to be a bit more creative, but ultimately relied entirely on information the company shared publicly by looking at every blog post, public press release, twitter thread and article that was ever posted about Ramp’s fundraising efforts and/or company metrics since inception (each of which contains some similar information and some channel-specific info).
As an aside, I really appreciate that Eric Glyman cares about conveying empirical metrics, and hope he doesn’t stop doing it even when he sees how much we can derive from them. On the flip side, with AI, it’s increasingly easier to piece together the metrics, so let’s just make it simpler for everyone and share all the metrics in one place instead of across several articles.
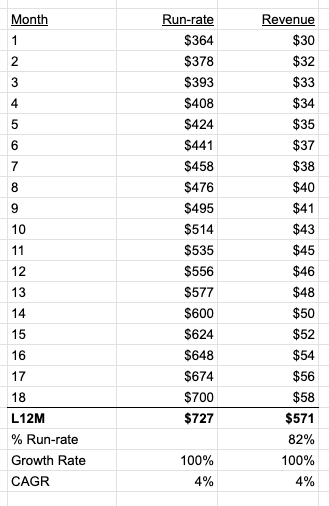
In any case, in the most recent update on the $13B valuation, you’ll find that while the press release doesn’t mention revenue, the TechCrunch article does mention a $700M run-rate revenue number and . Now technically, we should discount this based on the delta between run-rate revenue and annual revenue and given Ramp’s growth rate I expect that discount to be ~15-20%+ which is what I’ve applied in my analysis.
To get to gross profit, you have to make some assumptions about Ramp’s revenue and in turn its payment volume. The biggest question people have when they look at the revenue number is, is this number gross or net? More specifically, is the $700M revenue based on Ramp’s revenue after their 1.5% cash back (net) or before the cash back (gross). This is the one place where Ramp has never been very clear (hint hint Eric), but there are ways to derive it.
The Cumulative Savings calculation: Ramp always uses a Cumulative Savings calculation to share how much they’ve saved their customers. That means we can first calculate the incremental savings by subtracting chronological messages. In the latest post, they mentioned $2B of cumulative savings whereas in August 2023 (not 2024 but close enough) they noted $600M in cumulative savings for an incremental $1.4B in 2024. Meanwhile, as of August 2023 they said that savings is made up of (A) 1.5% cash back + (B) 2% spending more responsibly. So if we use these numbers, $1.4B translates to ~$40B in spend volume
Interestingly, they quote $55B in payments volume for 2024, which likely means they have ~$15B in billpay volume in that payments volume figure
Funnily enough, Ramp did not mention the 3.5% savings rate in the latest post and when you go to their website, they now quote a 2.5% savings rate (ex. replacing legacy systems), but not sure what to make of it
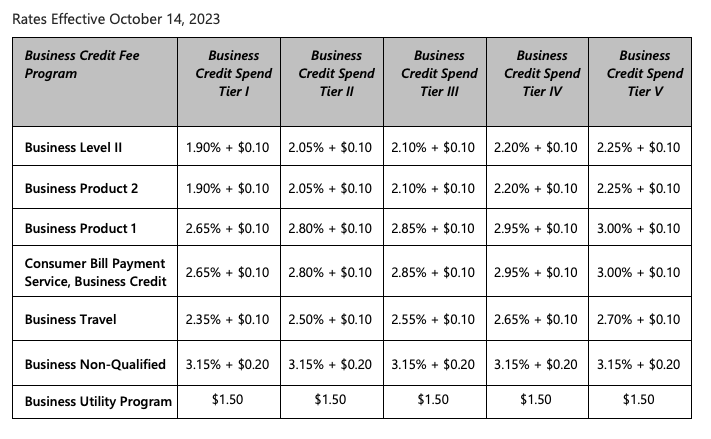
The take rate build-up calculation: With $700M in revenue, we could use a net revenue take rate of ~2% (~3.25%-3.50% gross less 1.5% cash back) to estimate what spend volume must be which gets to ~$35B in spend volume
I’m sure that interchange rate seems unrealistically high, but check out Visa’s IRF tables for business credit! And this blended across Card Present and Card Not Present. Imagine what Business Credit Tier V rates are for online advertising spend!
So between these two methods, we can have some confidence that Ramp’s $700M revenue number is reported net of its cashback rate, and then we can assume something like ~70-80% gross margin as is typical for scaled fintechs like Chime and CashApp.
(Side note: If people are curious about Ramp’s ramp in terms of metrics, I might have a follow-up post on that, if nothing else because I truly over-engineered the gathering of these metrics and want to share).